Evaluating Subscription Value Through Aggregated Performance Indicators Across Multi-Sport Selections
Written by Theo Lehmann · Aug 31, 2026
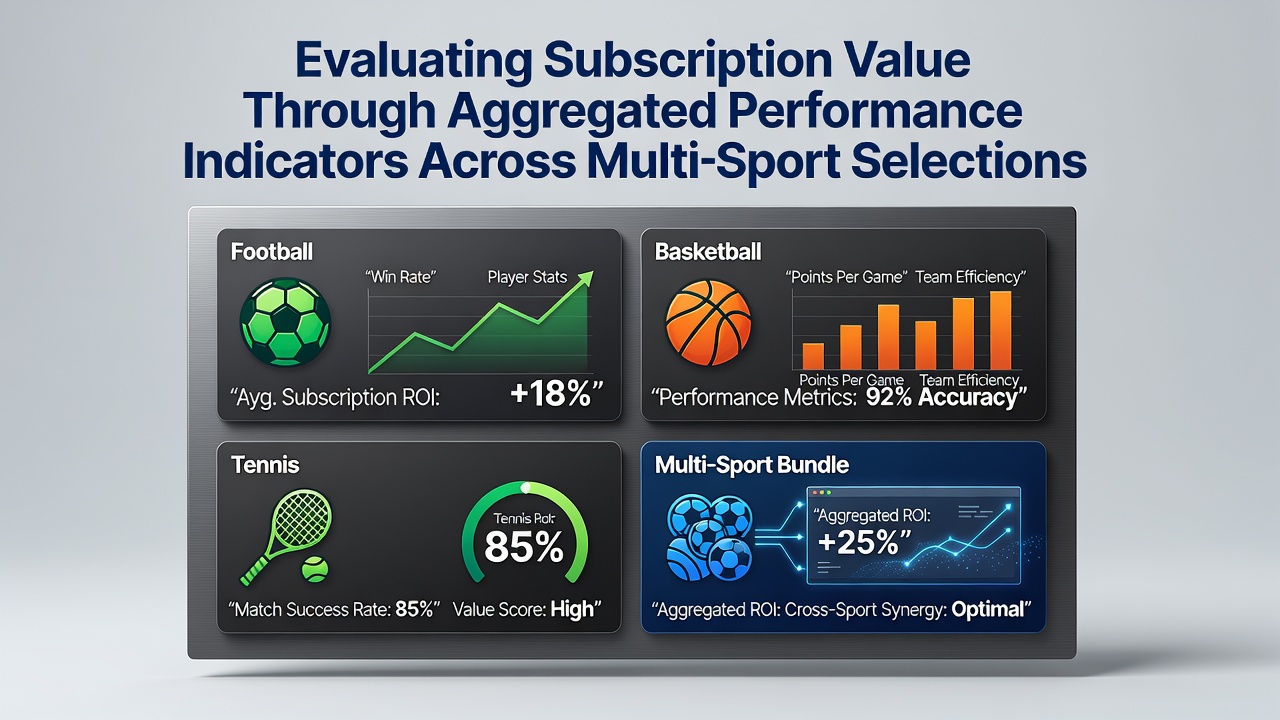
Evaluating Subscription Value Through Aggregated Performance Indicators Across Multi-Sport Selections
Subscribers to multi-sport tipster services track value through aggregated performance indicators that combine results from football, horse racing, and tennis selections into unified metrics. These indicators include overall return on investment, hit rates, and yield calculations that blend outcomes across different disciplines rather than isolating single-sport performance. Data aggregation allows observers to assess whether a subscription delivers consistent returns when selections span varied markets and risk profiles.
Core Indicators in Multi-Sport Contexts
Researchers define return on investment as the percentage profit or loss relative to total stakes placed across all sports covered by a subscription. Hit rate measures the proportion of winning selections, while yield adjusts for stake sizes and odds variations that differ between football accumulators, each-way horse racing bets, and tennis match props. Aggregated figures reveal patterns that separate indicators might obscure, such as strong tennis performance offsetting weaker football results during specific periods.
Those who analyze subscription data often compile monthly reports that weight each sport according to the volume of tips provided. A service issuing fifty football predictions, thirty horse racing tips, and twenty tennis selections in a given month requires proportional weighting so that one sport does not dominate the overall calculation. This approach produces a composite score that reflects the actual mix of selections subscribers receive.
Aggregation Techniques Across Disciplines
Analysts apply weighted averages and rolling averages to smooth short-term fluctuations while preserving long-term trends in multi-sport portfolios. For instance, a three-month rolling average combines results from August 2026 with prior periods to identify whether performance has stabilized or declined after seasonal changes in racing calendars and tennis tournaments. Software platforms automate these calculations by pulling data directly from bookmaker settlement records and tipster declarations.
Standard deviation calculations quantify consistency across sports, showing whether returns vary widely between football and horse racing selections or remain relatively stable. Lower standard deviation values indicate more predictable outcomes, which matters for subscribers who allocate fixed bankrolls to each sport. Correlation analysis between sports further refines evaluation by highlighting when results move independently or cluster during overlapping events such as major football weekends coinciding with Grand Slam tennis.

Data Sources and Verification Methods
Verification relies on cross-referencing tipster claims against independent records from betting exchanges and official race results. Industry reports from the American Gaming Association supply benchmarks for average returns in regulated markets, allowing subscribers to compare their chosen service against broader sector performance. Academic studies published in the Journal of Gambling Studies provide peer-reviewed methodologies for calculating aggregated metrics that account for different odds formats and market liquidity levels across regions.
Those evaluating subscriptions also examine transparency reports that list every selection with its odds, stake, and outcome. Services publishing such reports enable direct calculation of aggregated indicators without relying on summarized claims. Data from the Responsible Gambling Council in Canada offers additional context on how transparent reporting influences subscriber retention across multi-sport offerings.
Practical Application in Subscription Decisions
Subscribers apply aggregated indicators when comparing multiple services by normalizing results to a common stake unit and time frame. A service showing a 12 percent overall yield across 300 selections distributed among three sports can be ranked against another showing 9 percent yield across 400 selections with a different sport mix. Normalization prevents volume differences from skewing direct comparisons.
Seasonal adjustments account for variations such as increased horse racing fixtures in summer months and concentrated tennis schedules during major tournaments. These adjustments prevent August 2026 data from being misinterpreted when fewer racing meetings occur compared with peak periods. Observers note that services maintaining positive aggregated yields through schedule shifts demonstrate stronger value retention than those whose performance spikes only during high-volume months.
Limitations and Refinement Approaches
Aggregated indicators can mask underperformance in one sport if another compensates with stronger results, so segmented breakdowns remain essential alongside composite scores. Outlier events, including long-priced winners in horse racing or unexpected tennis upsets, require separate treatment to avoid distorting monthly aggregates. Refinement techniques include trimming the top and bottom 5 percent of results before final calculation, which produces more stable trend lines.
Software tools increasingly incorporate machine learning models that detect when aggregation methods need recalibration based on changing market conditions or tipster strategy shifts. These models process historical data from multiple sports simultaneously to recommend updated weighting schemes that better reflect current subscription offerings.
Conclusion
Evaluating subscription value through aggregated performance indicators provides a structured framework for assessing multi-sport tipster services. The combination of return on investment, hit rates, yield, and consistency metrics across football, horse racing, and tennis creates a comprehensive view that single-sport analysis cannot achieve. Verification against independent data sources and seasonal adjustments further strengthen the reliability of these evaluations. Subscribers who apply these methods gain clearer insight into whether a service delivers measurable value across its full range of selections.