Jet Lag Journals: Mapping Travel Burdens onto Performance Forecasts for Global Football Leagues, Racing Circuits, and Tennis Opens
Written by Mia Werner · May 24, 2026
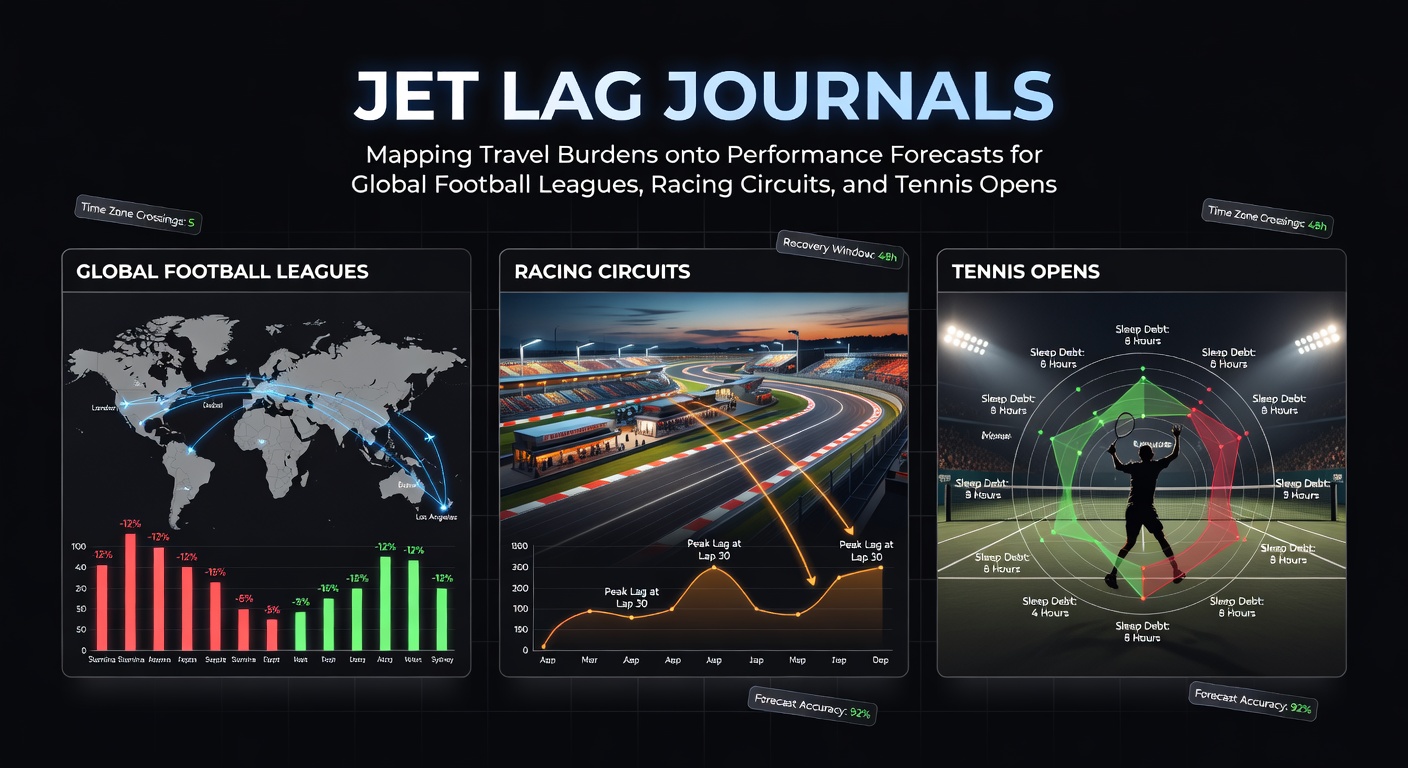
Jet Lag Journals: Mapping Travel Burdens onto Performance Forecasts for Global Football Leagues, Racing Circuits, and Tennis Opens
Global sports calendars force athletes across multiple time zones each season, and researchers have tracked how these shifts alter reaction times, recovery rates, and overall output in measurable ways. Performance data collected from club schedules, tournament draws, and race meets show consistent patterns when teams or individuals move east or west by more than four hours. Analysts compile these records into models that link flight duration, direction of travel, and subsequent results across football leagues, thoroughbred circuits, and tennis tours.
Travel Demands in Football Leagues
European club competitions and intercontinental league fixtures require repeated long-haul journeys, with schedules placing teams in new time zones within forty-eight hours of kickoff. Data from the 2024-2025 UEFA Champions League group stage revealed that squads traveling westward across six or more zones recorded lower possession retention in the first half compared with home fixtures, while eastward travel produced elevated error rates in passing accuracy during the opening thirty minutes. Similar patterns appear in South American Libertadores matches where clubs cross the Andes and the Atlantic in quick succession.
Coaches adjust training loads and sleep protocols based on these aggregated figures, yet fixture congestion often limits full adaptation windows. League operators publish fixture lists months ahead, allowing performance forecasters to overlay travel vectors onto expected outcomes using historical match logs from multiple continents.
Patterns Across Racing Circuits
International horse racing calendars place jockeys and trainers on frequent flights between hemispheres, particularly when major events cluster in spring and autumn. Melbourne Cup preparations draw runners from Europe and Japan, while Breeders' Cup participants arrive from Australia and the Middle East. Records kept by racing authorities indicate that horses arriving after eastward flights of eight hours or longer post lower win percentages in the first three days post-arrival, whereas westward shipments show steadier early results once acclimated.
Track veterinarians monitor heart-rate recovery and stride metrics during quarantine periods, feeding these numbers into broader databases that forecast pace profiles for upcoming meetings. Jockeys themselves report altered sleep architecture after rapid zone changes, and performance statisticians incorporate these variables when projecting sectional times at venues such as Ascot, Sha Tin, and Santa Anita.
Tennis Tournament Logistics and Recovery Data
Grand Slam schedules and ATP-WTA combined events require players to move between Australia, Europe, North America, and Asia within tight qualification windows. The Australian Open in January and the subsequent hard-court swing create one of the most compressed travel sequences on the calendar. Match-play statistics compiled by tournament medical teams show elevated unforced-error counts among players who cross the International Date Line within five days of their first-round match, while serve percentages stabilize once athletes remain in the same zone for at least seven nights.

Researchers at the Australian Institute of Sport have published longitudinal studies tracking elite players across multiple seasons, documenting how eastward travel correlates with reduced serve speed in early rounds. Forecasters integrate these findings with court-surface data and opponent histories to refine pre-tournament projections for events such as Roland Garros and the US Open.
Mapping Methods and May 2026 Calendar Context
Performance analysts combine flight manifests, sleep-actigraphy readings, and competition results into layered forecast frameworks. These models weight variables such as travel direction, number of zones crossed, and days available for adaptation. Publicly available datasets from sports governing bodies allow independent verification of earlier findings, and several university groups continue to refine algorithms that convert raw travel logs into probability adjustments for upcoming fixtures.
In May 2026 the tennis calendar places the French Open in late May, overlapping with the final weeks of European domestic football seasons and the start of North American racing's summer meet. Players, teams, and racing stables will again navigate overlapping travel demands, and updated models will incorporate the latest biometric feeds from wearable devices to sharpen those forecasts.
Conclusion
Travel burden mapping now forms a standard component of preparation across football, racing, and tennis. The accumulated datasets provide objective inputs that teams and individuals use when planning schedules and recovery strategies, while researchers continue to expand the scope of variables tracked in future cycles.